 RequestBin docs
 Github Webhooks
In this example, we'll be configuring a new endpoint to accept HTTP POST requests from a Github webhook. We'll walk through the configuration for the example webhook on Github, and we'll see how to examine these requests in the inspector.
Create your endpoint
First, you'll need to create a new endpoint specific to this webhook integration and have the endpoint URL ready for the next step.
Configure your Github webhook
Github's Webhook Docs outline the process for creating a webhook. You can create a webhook tied to any Github organization or repository. In this example, our webhook is attached to a test repository, pipedream-test-webhook.
In the Github webhook configuration, add the endpoint URL from the first step as the Payload URL. You can set the Content-type to either application/x-www-form-urlencoded or application/json: the endpoint will accept content of both types.
In this example, we'll limit the webhook to Just the push event, so that only pushes will trigger new webhook requests from Github:

Save the webhook configuration.
Inspecting the ping event
Github sends an initial, ping event to confirm the configured Payload URL accepts POST requests and responds with a 2XX HTTP status code. In your Github webhook settings, you should see a green checkmark next to the endpoint URL:
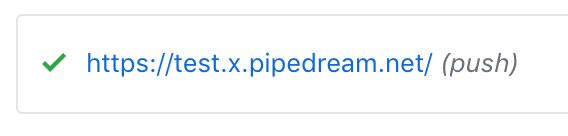
In the RequestBin inspector, you should also see the body and headers associated with the ping event. This event isn't interesting to us, but it proves that the webhook is configured correctly end-to-end.
Inspecting push events
Commit any new code to your test repository and push those changes to Github. Shortly, you should see a new POST request appear in the inspector (bolded to indicate that it hasn't been viewed).
The JSON Body should contain information about the branch, commits, and associated repository.
Now that you've confirmed new push events appear in the inspector, you can use the inspector to examine the Body and Headers associated with subsequent pushes.
Questions or Feedback?
Please reach out with any questions or suggestions.